Dow Daily Log Return for 80 Years (1928-2008)
Simply looking at the raw data, you should be convinced that it will fit the skew lognormal cascade distribution well.
However, fitting data with fat tails is not an easy task at all.
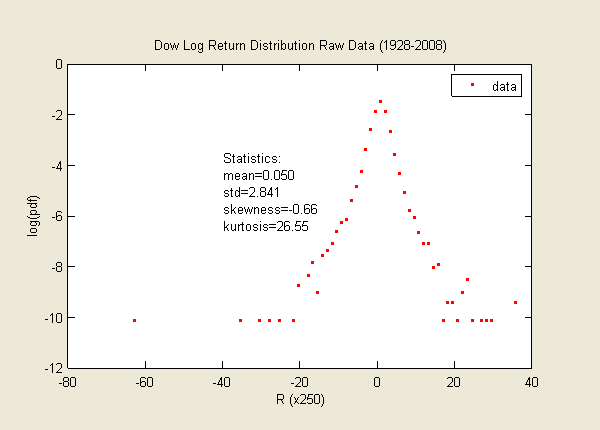
To make a good fit, we need to first remove the two outliers in the far left and far right.
We then use routine to obtain the best fit. Since tails weigh heavily in the skewness and kurtosis, we also need
to compare the skewness and kurtosis between the data and the theoretical values.
In addition, we need to ensure the mean is slightly positive (at least non-negative).
Here is a version of the fit. Not bad, right! However, savvy reader should notice that the fitted curve
is slightly fatter than the data. Indeed, in order to fit the skewness and kurtosis, the std overshoots 18%.
This problem arises from the fact that the DJIA has noticeable fat-tailed volatility, which will be addressed
only by the so-called "higher-order" lognormal cascade distribution (See below).
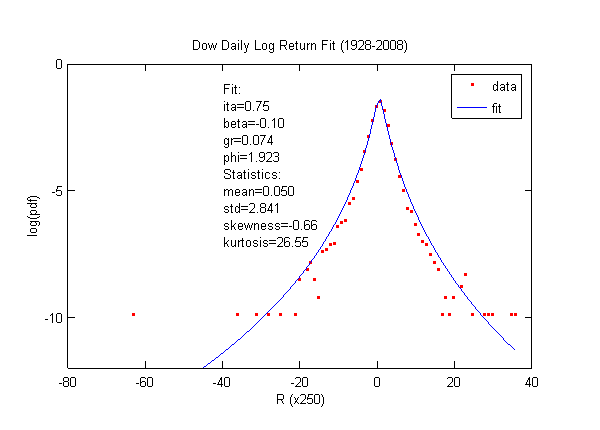
The eta is very high for the daily return. In my paper, I considered ten-day return, which yielded eta = 0.5.
Now when fitting one-day return, eta = 0.7. The scaling law is at work. Eta is increasing with smaller time interval.
And kurtosis increases exponentially with eta.
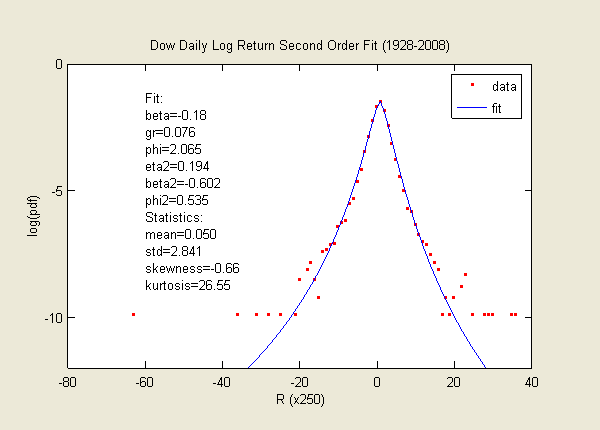
Below is a version of the fit to the "second-order" lognormal cascade distribution.
This fit is by far the best fit to all the elements of statistics -- the first four moments and
the vicinity of the peak probability density.
The second order distribution includes the concept similar to the volatility of volatility.
The detail is published in in June 2009.
Data Source: Yahoo Finance